Global Sales & Margin Dashboard
An interactive dashboard to visualize worldwide sales and profit performance
This dashboard has been created to showcase proficiency in Power BI. It is important to note that all data presented within this dashboard is entirely random and fictitious. None of the information reflects real-world data from any company or organization. The dataset was generated solely for the purpose of practice and to demonstrate data visualization and analytical skills using Power BI.
Project Overview
I built this interactive dashboard to give a clear picture of Vasran’s sales and profit margins around the world. It shows where they are selling the most, which products and segments are driving performance, and how things have changed over time.
Key Features
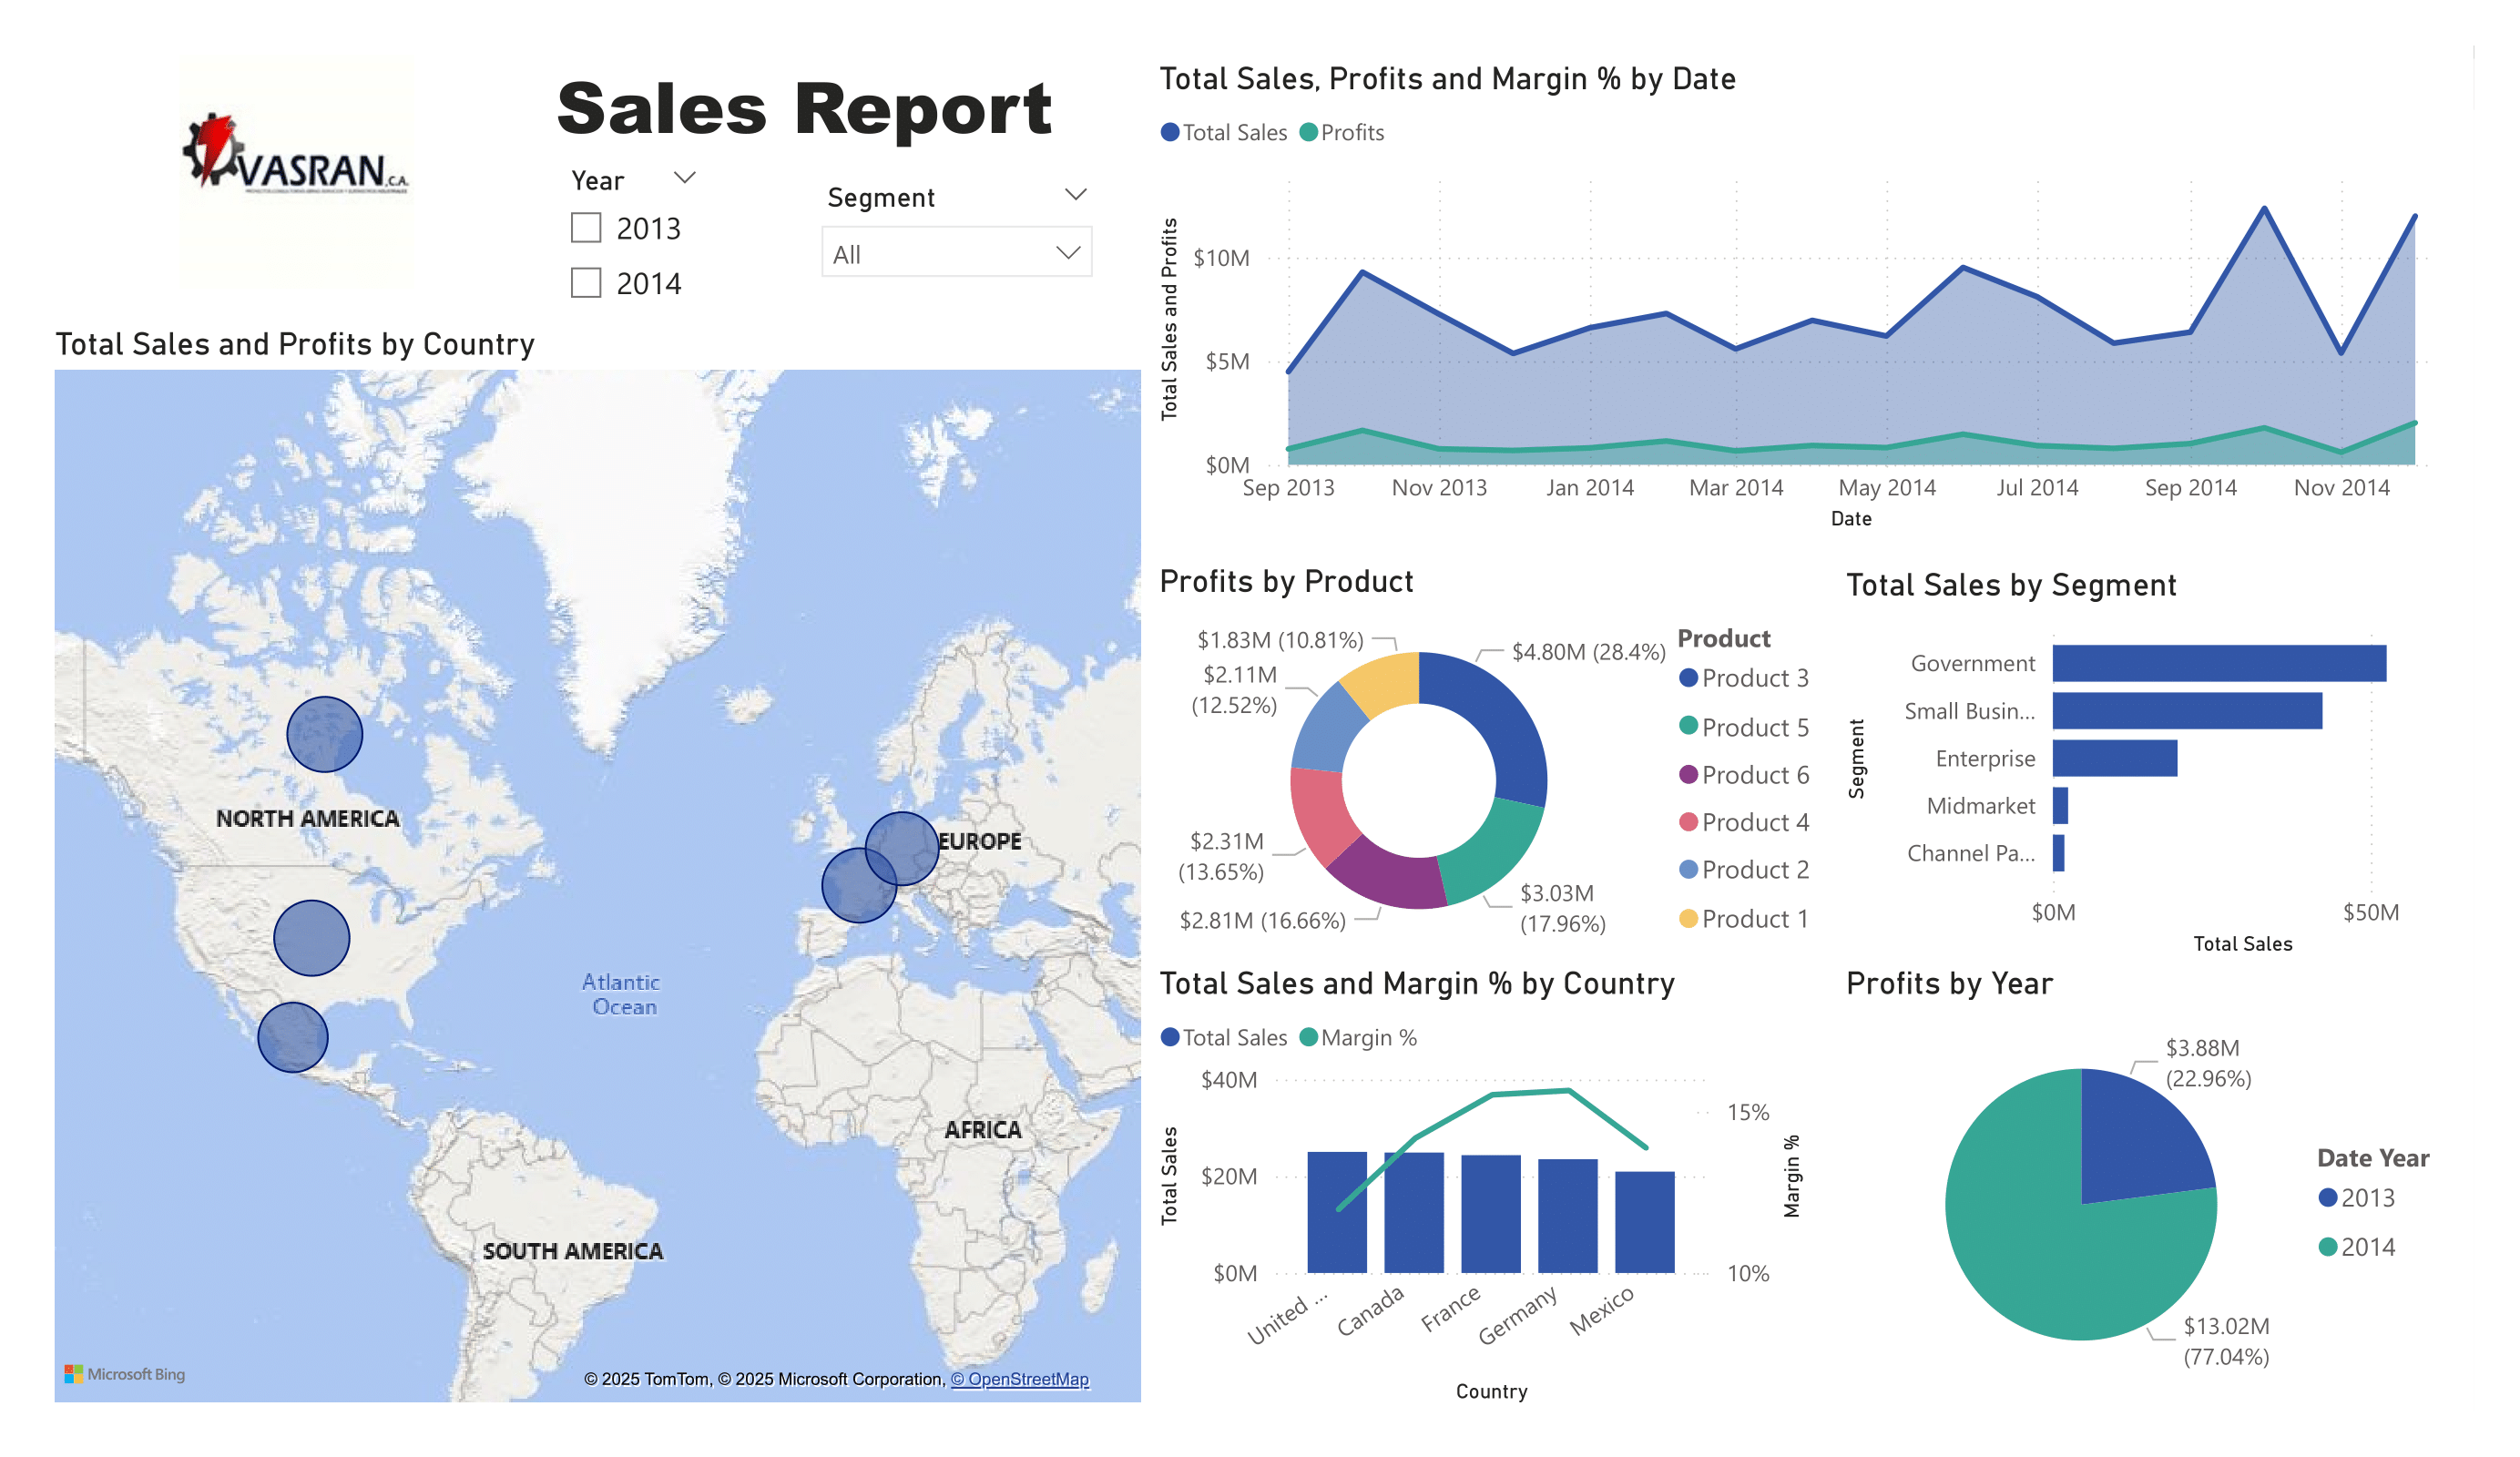
- Geographic Insights: A dynamic map visualizes total sales and gross margin by country.
- Time Trends: A combined area chart shows monthly sales and margin performance.
- Product & Segment Analysis: Breakdown of results by product category and business segment.
- Country Comparison: A combined bar and line chart compares sales with margin % for the top countries.
- Yearly Performance: Year-over-year gross margin overview.
Impact
This dashboard makes complex sales data easy to explore and understand. Decision-makers can filter by year or segment to quickly identify trends, opportunities, and areas for improvement.