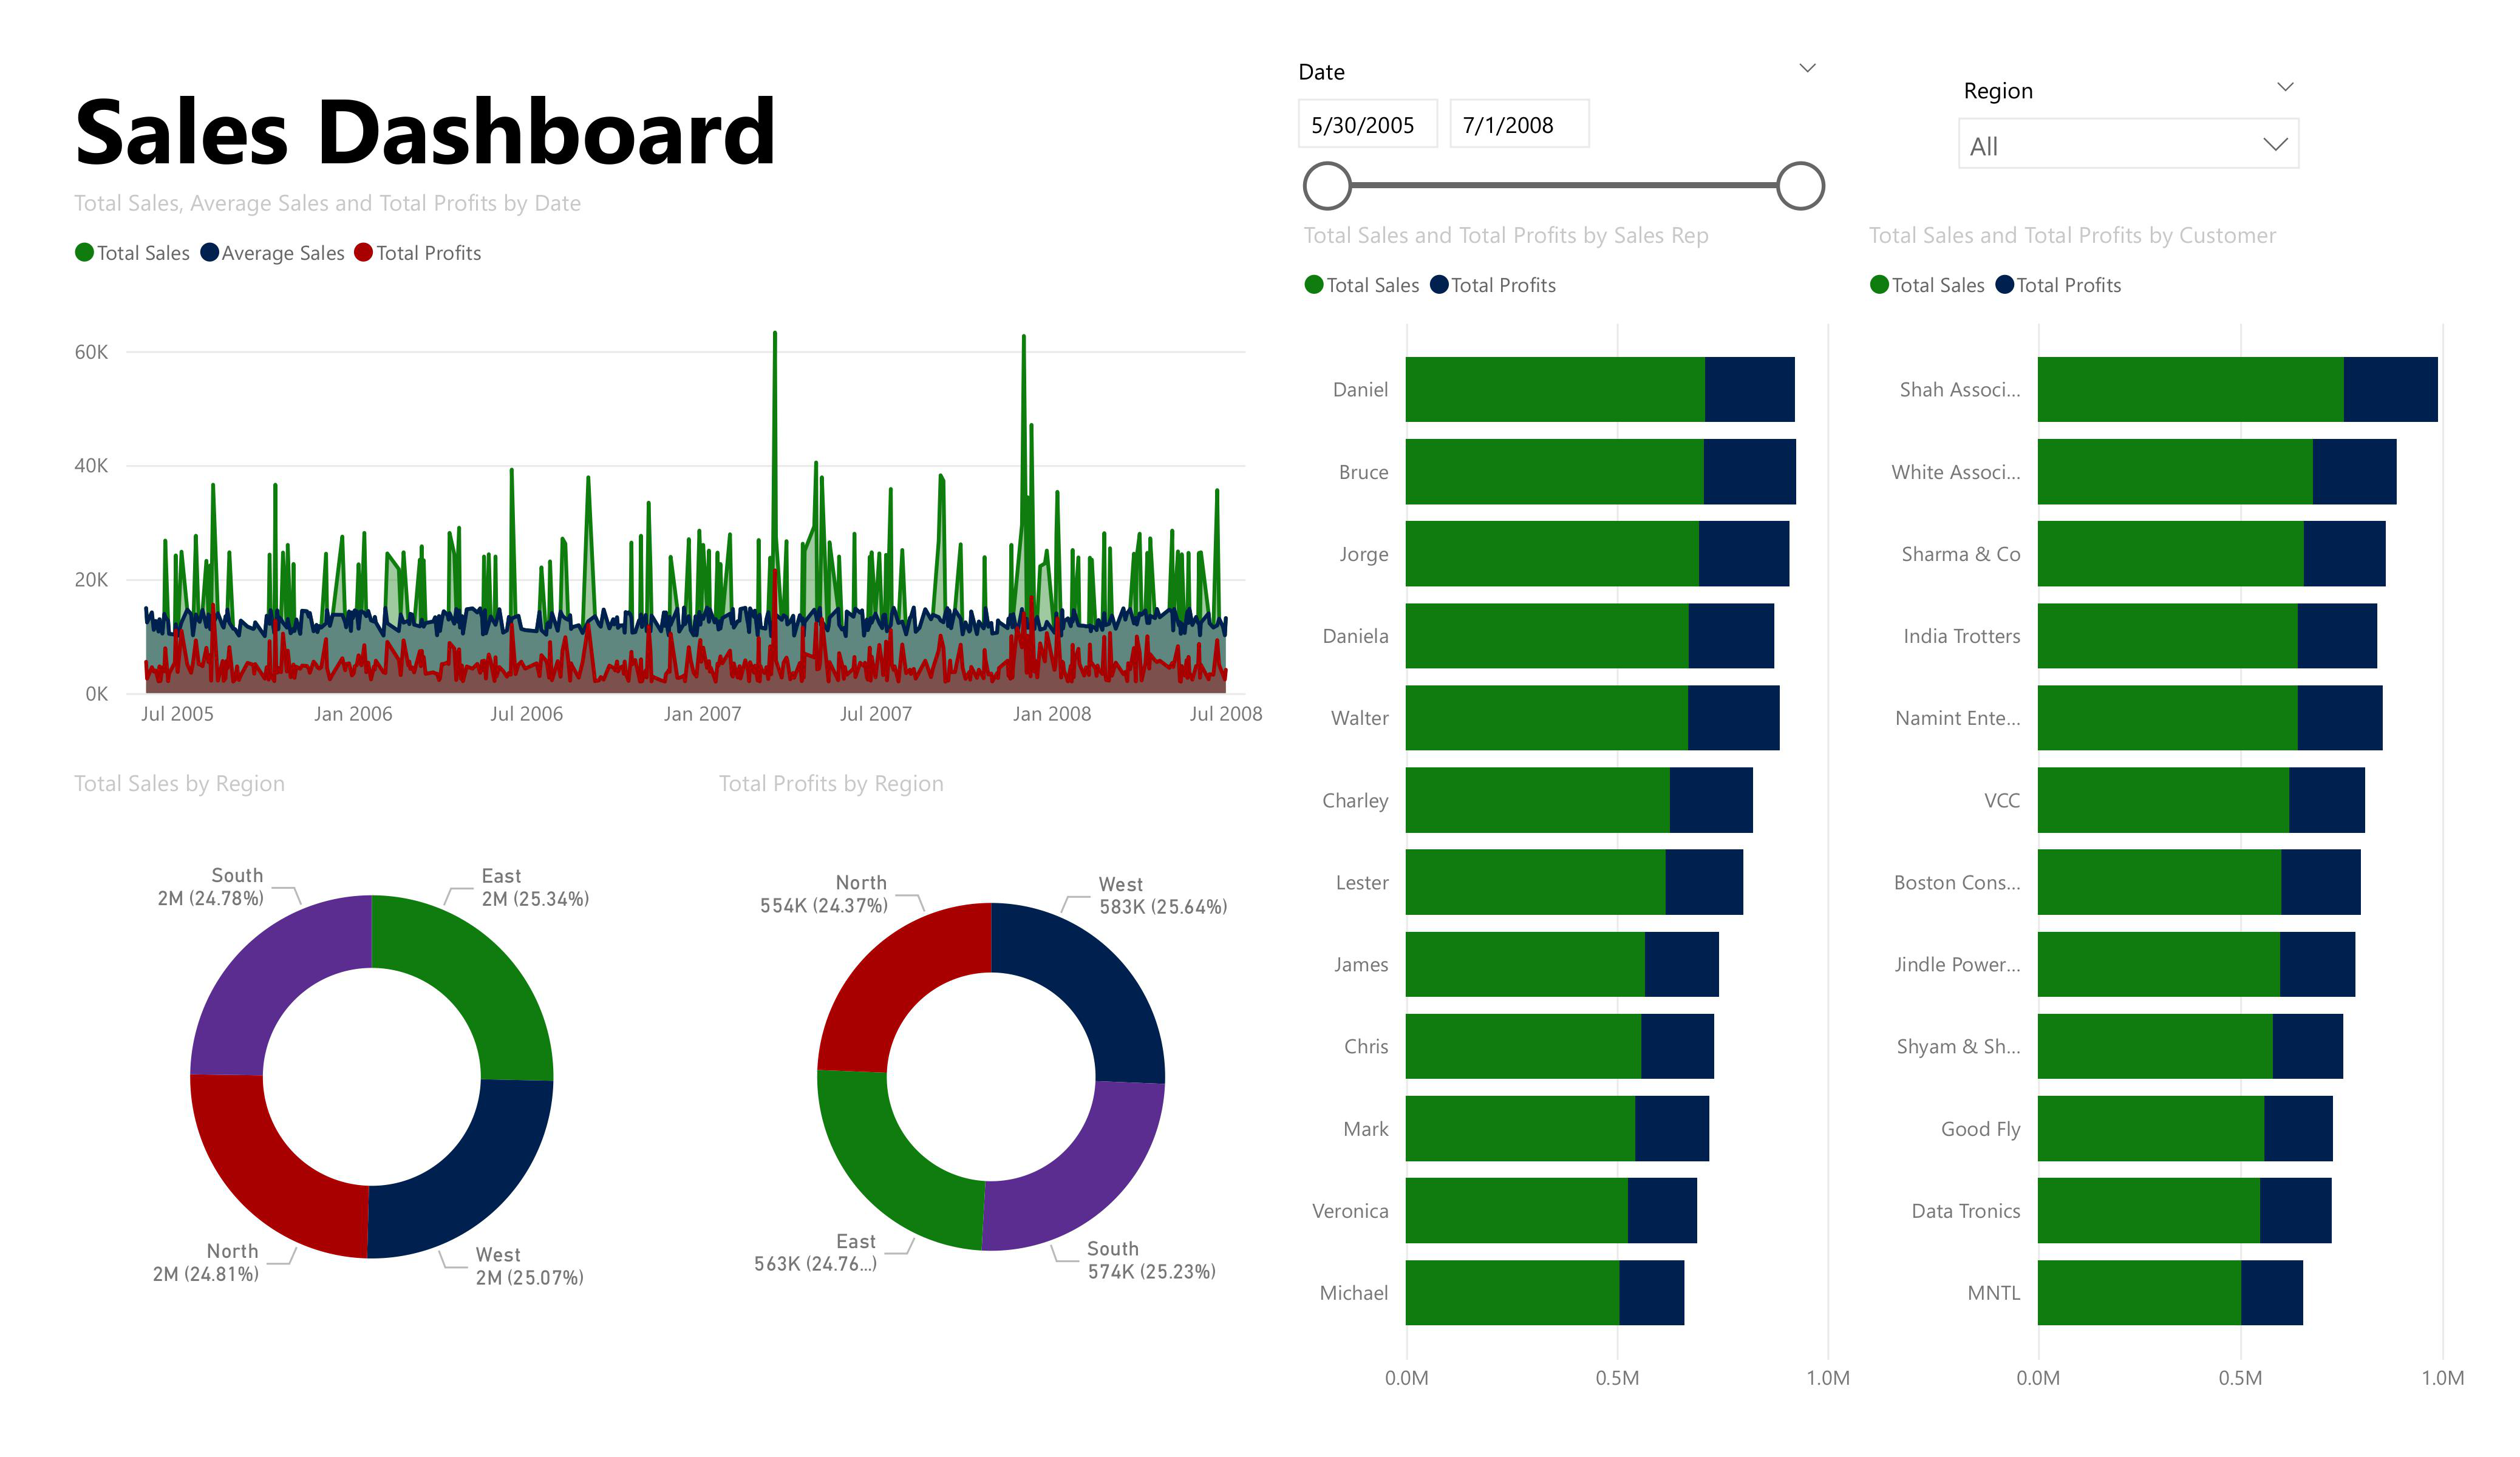
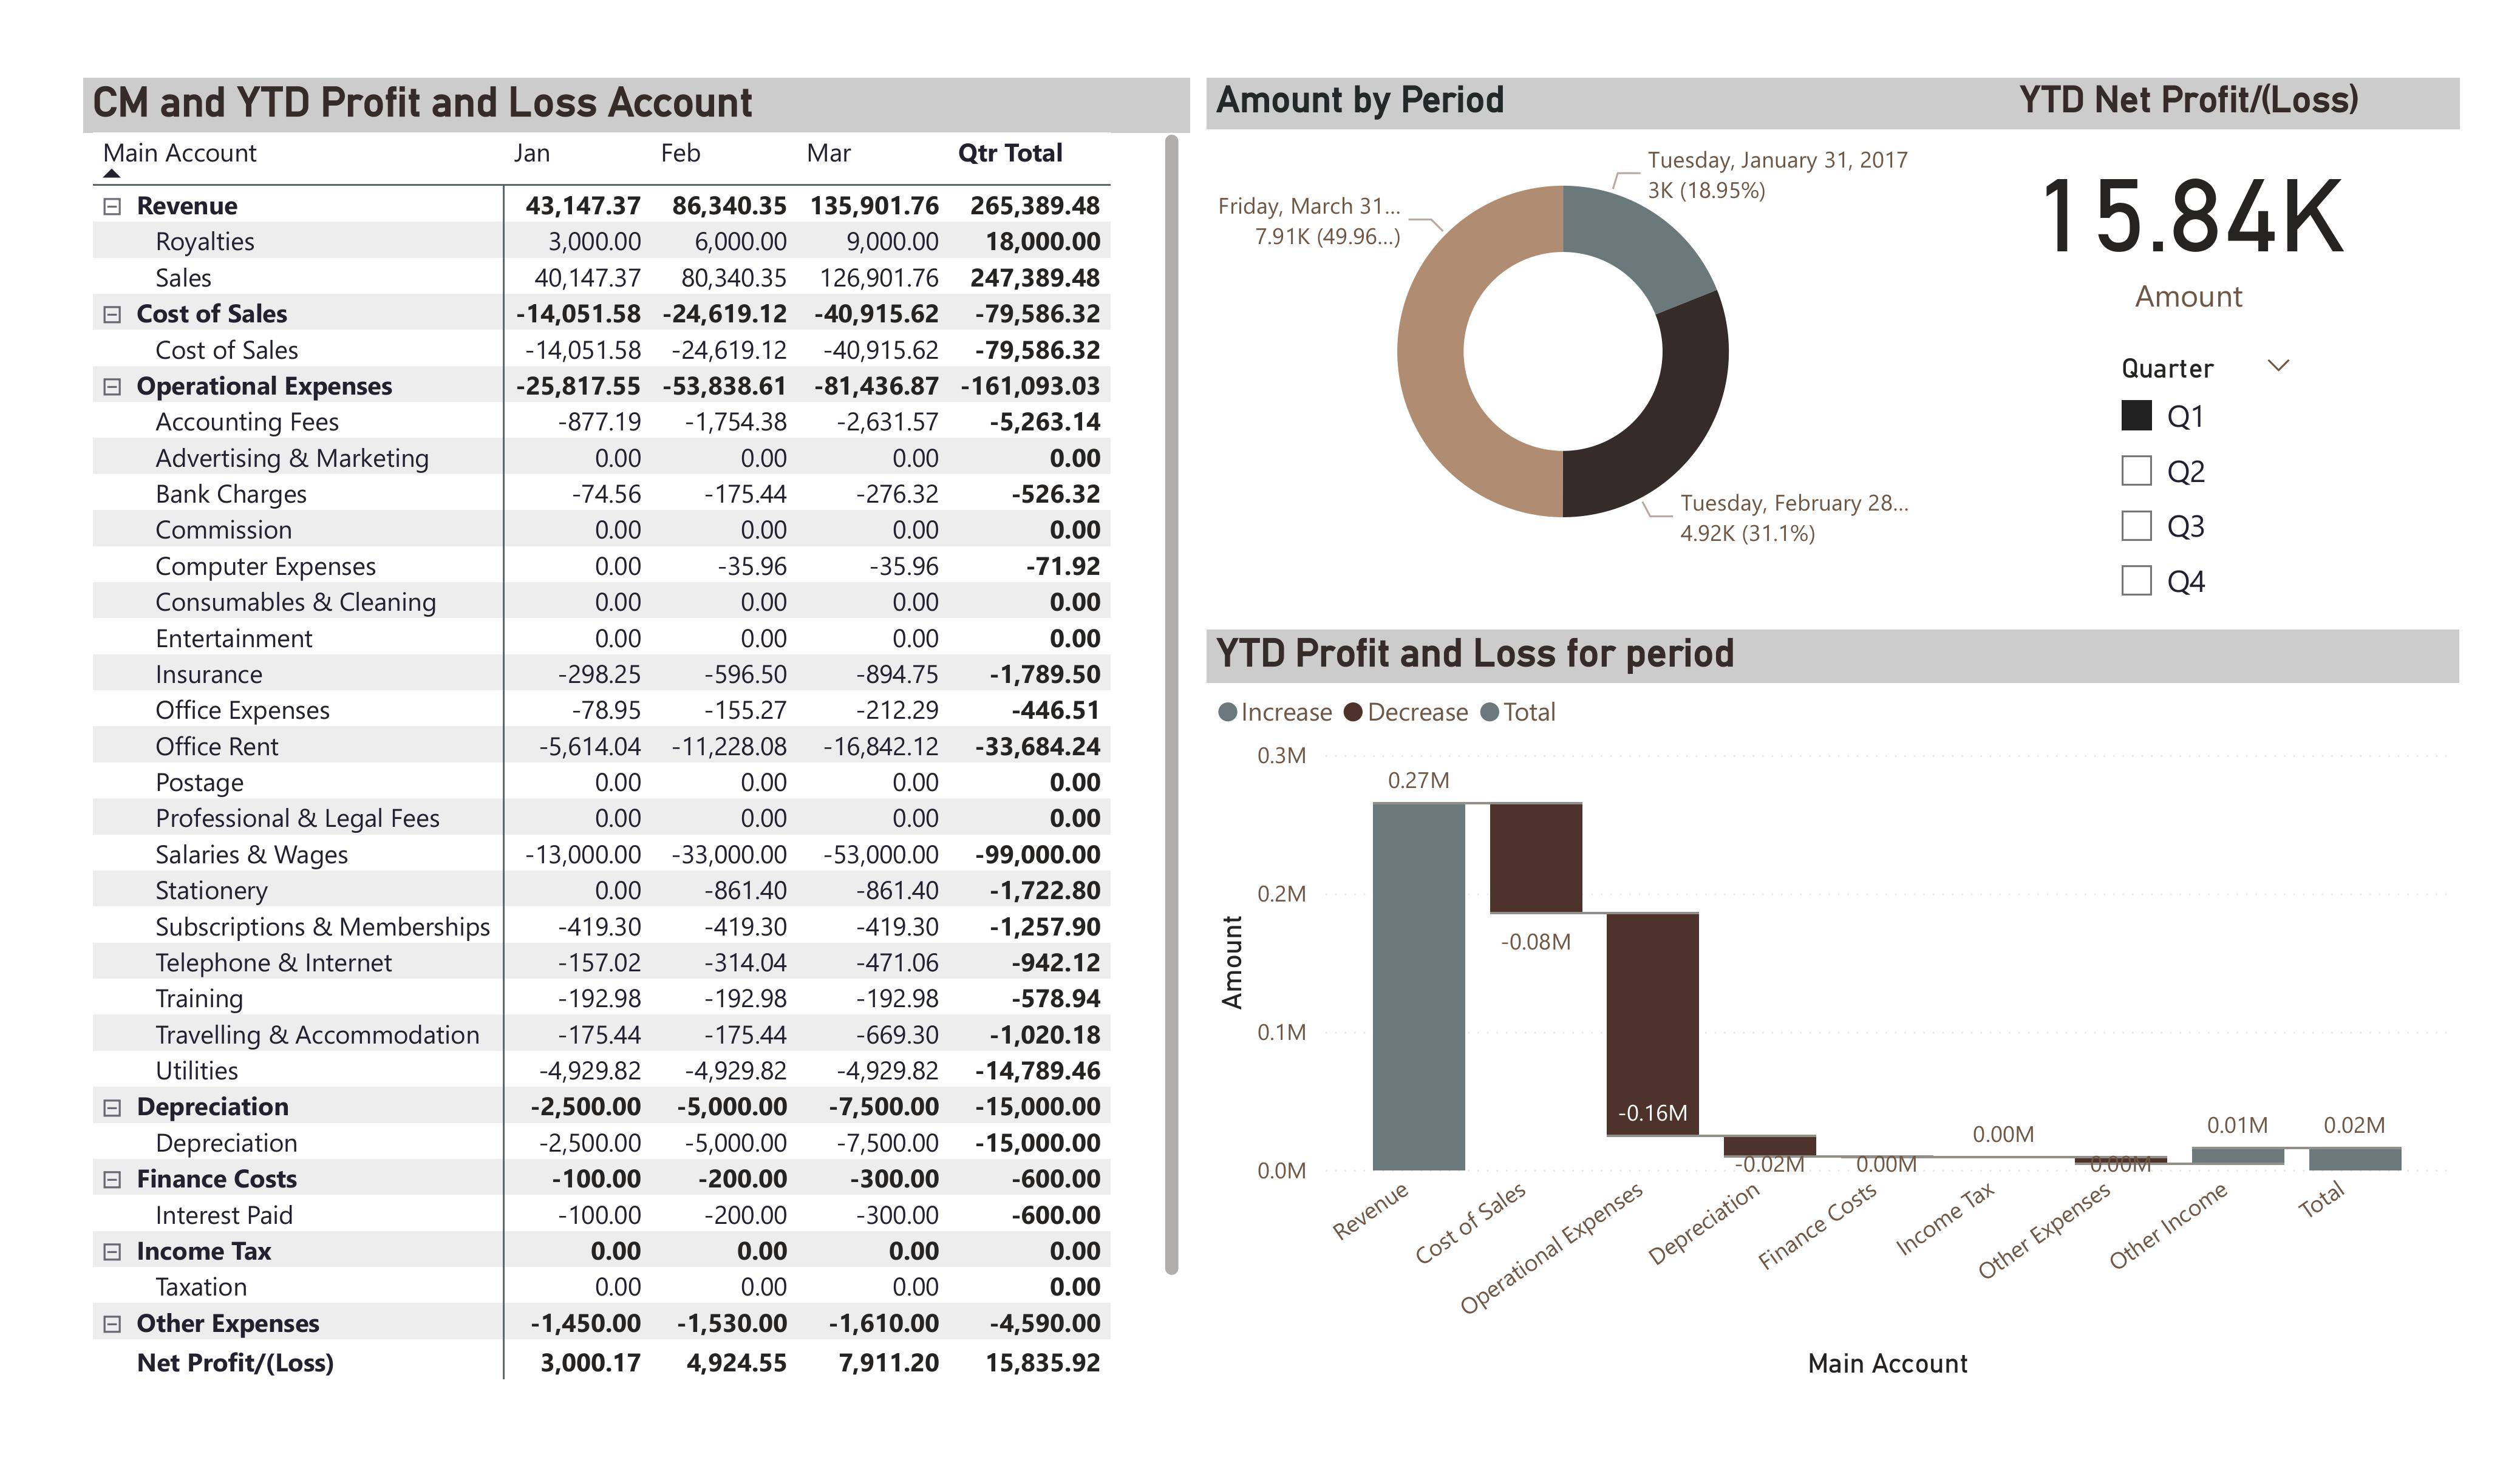
About Me

About Me

Hello! I'm Diego, an Industrial Engineer focused on technology-driven solutions that address real-world challenges, ensuring quality and operational efficiency, utilizing advanced analytical skills to exceed the expectations of each project.

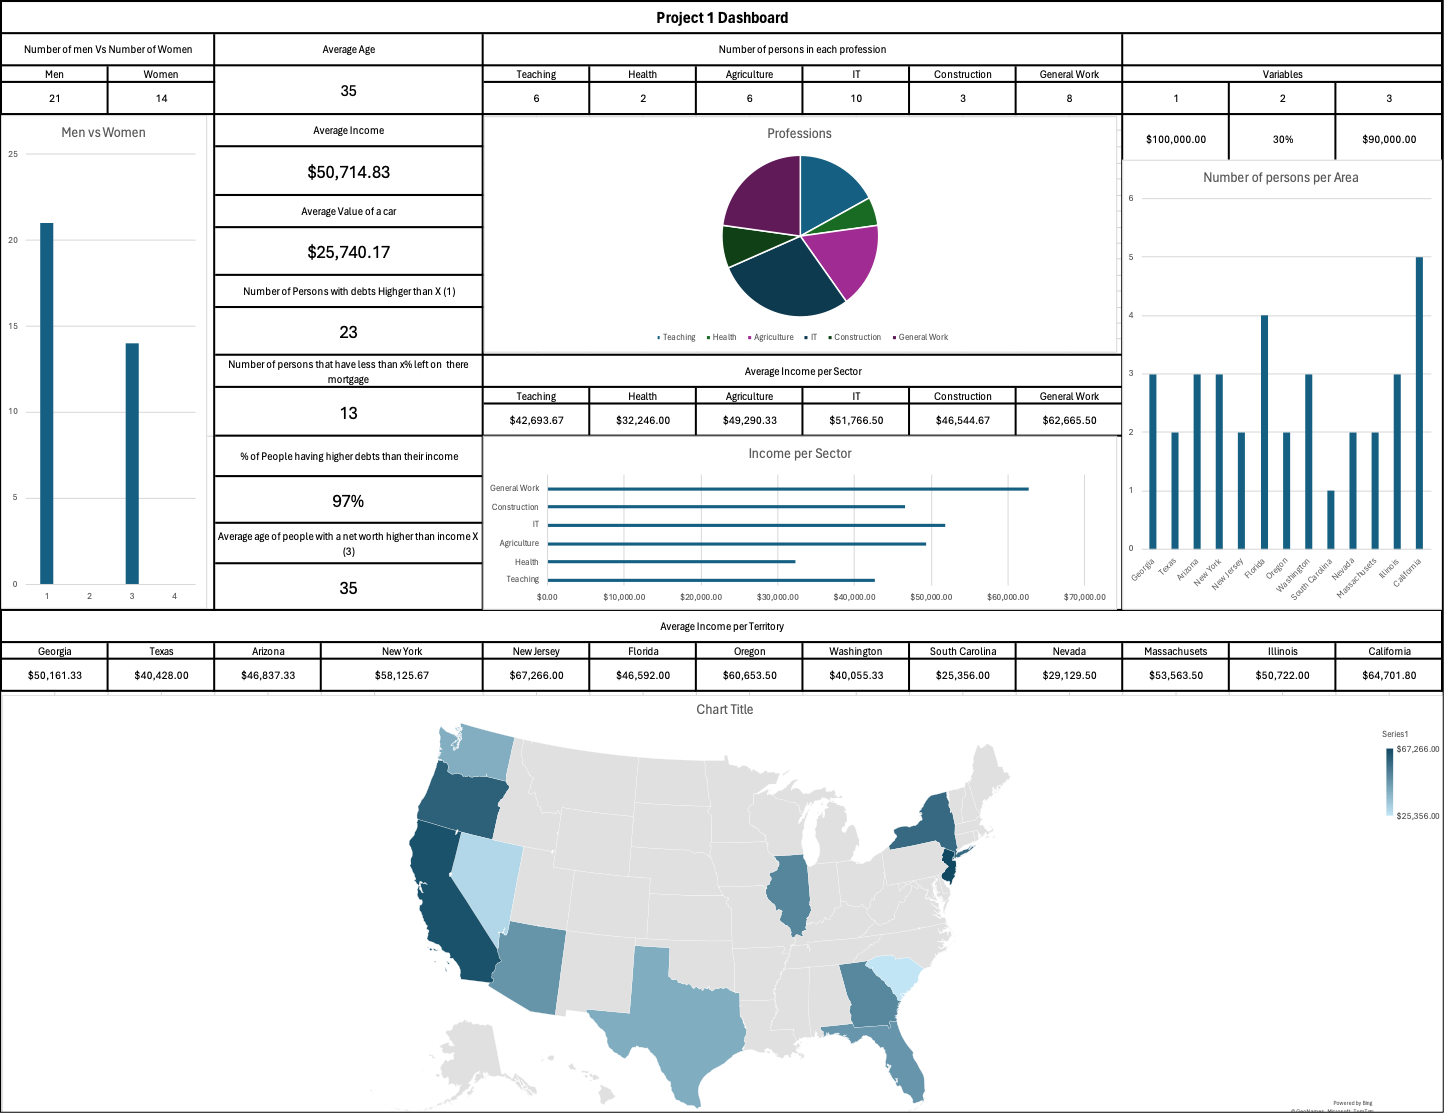
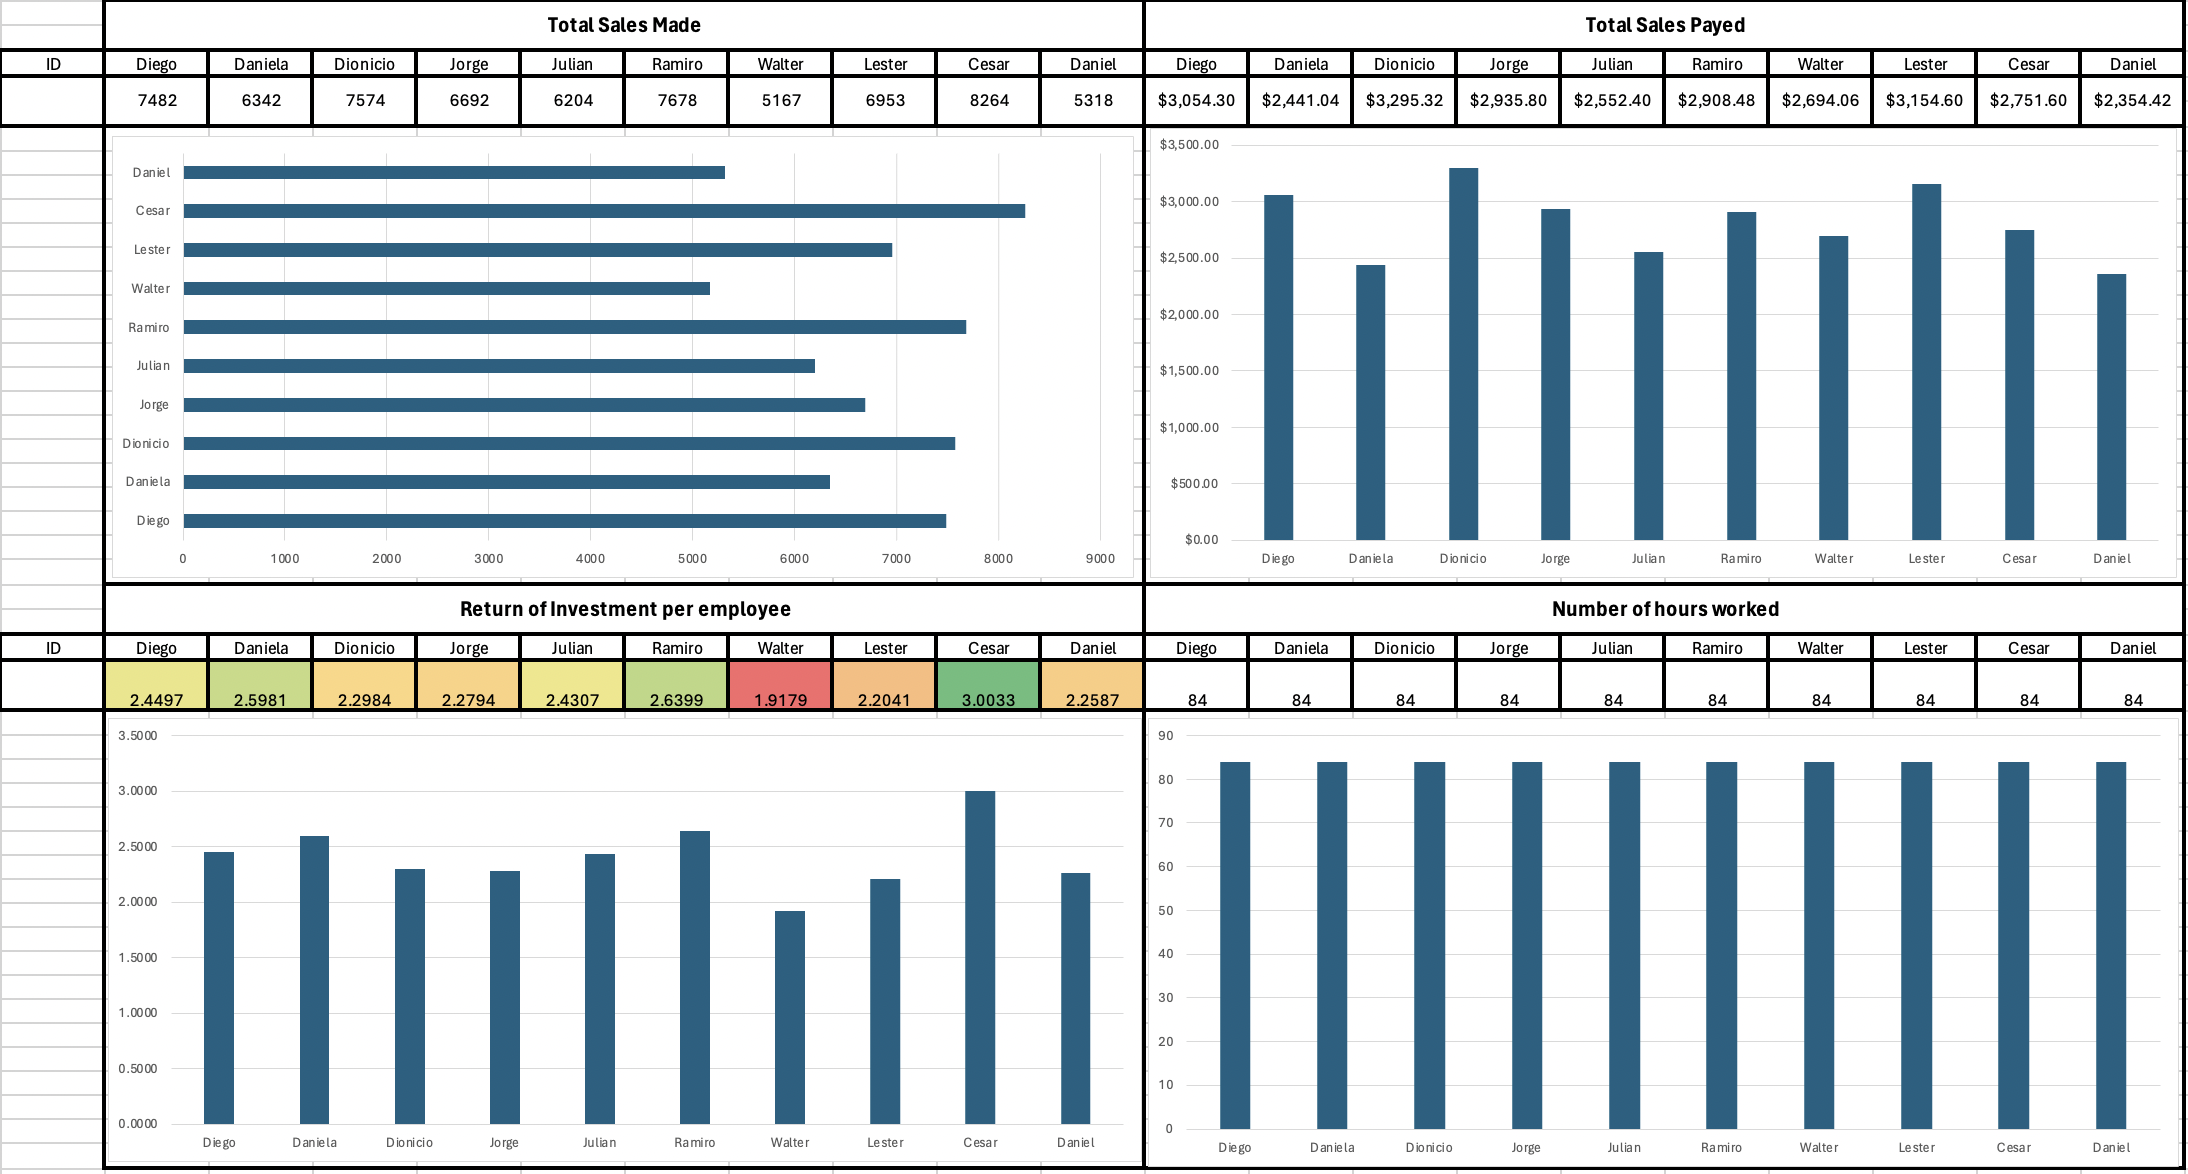
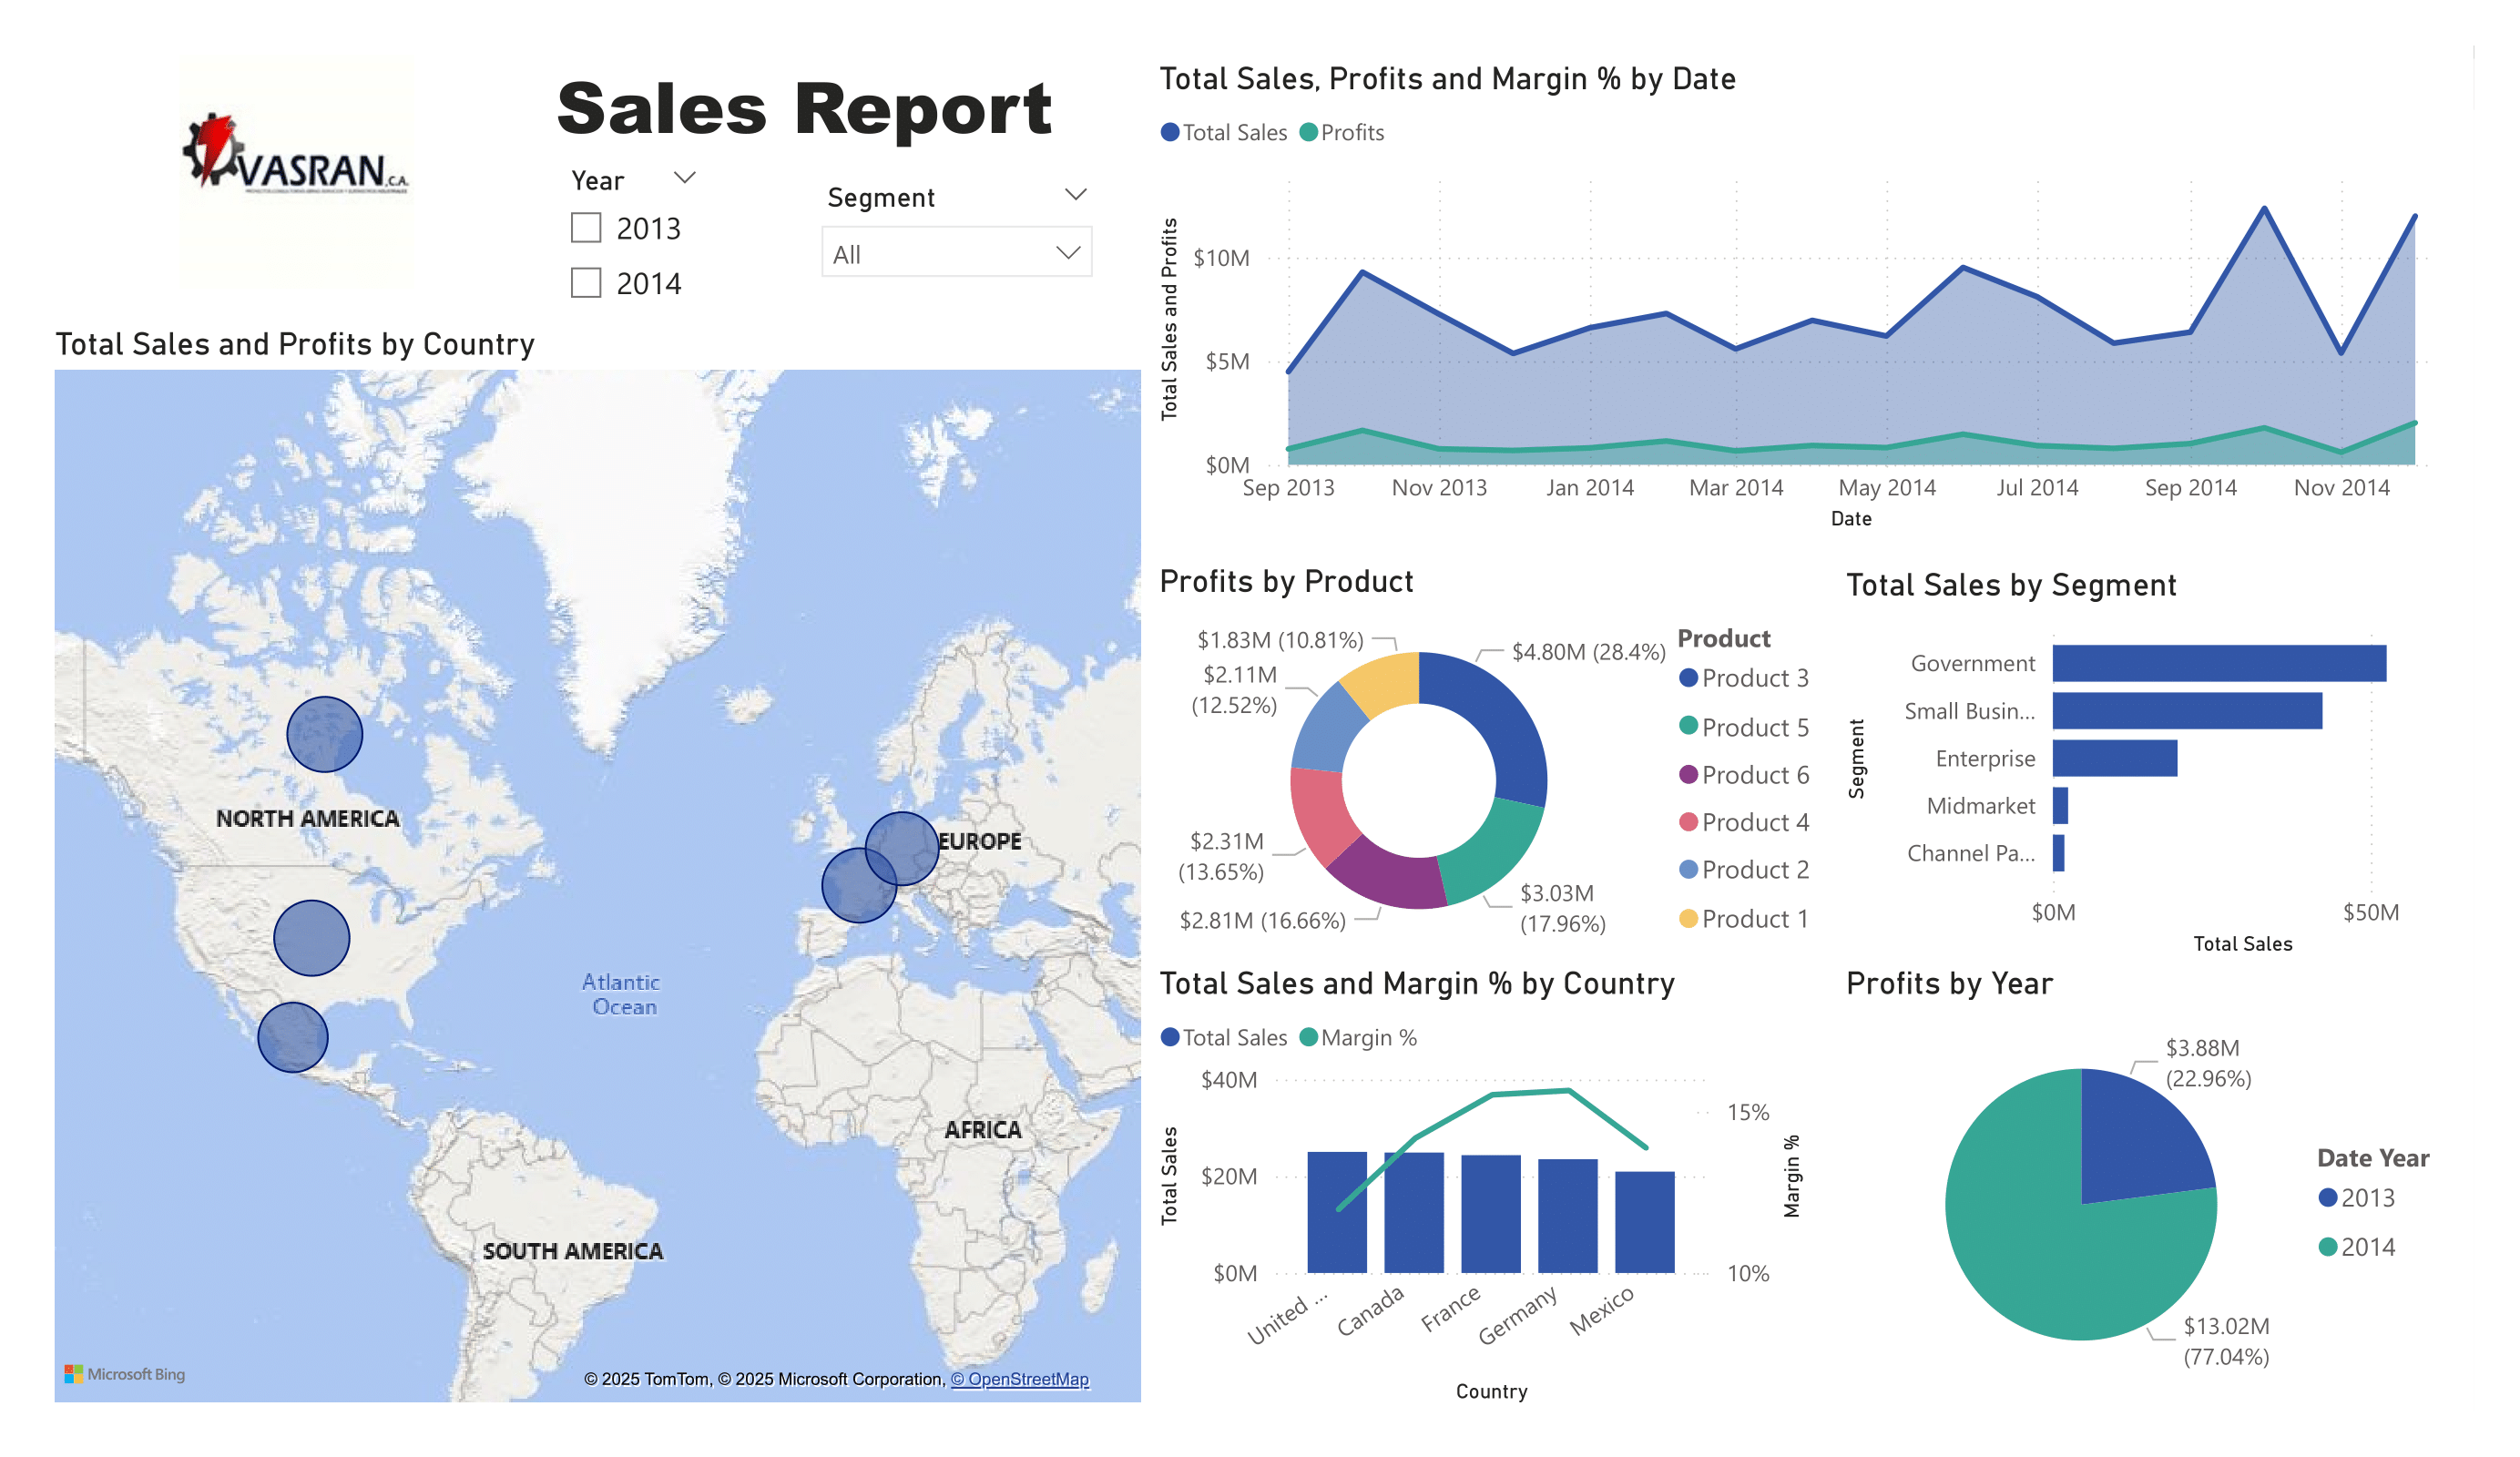
Skilled in inventory management, logistics, data analysis, and process optimization. I consistently demonstrate strong problem-solving abilities and continuous learning to grow professionally.

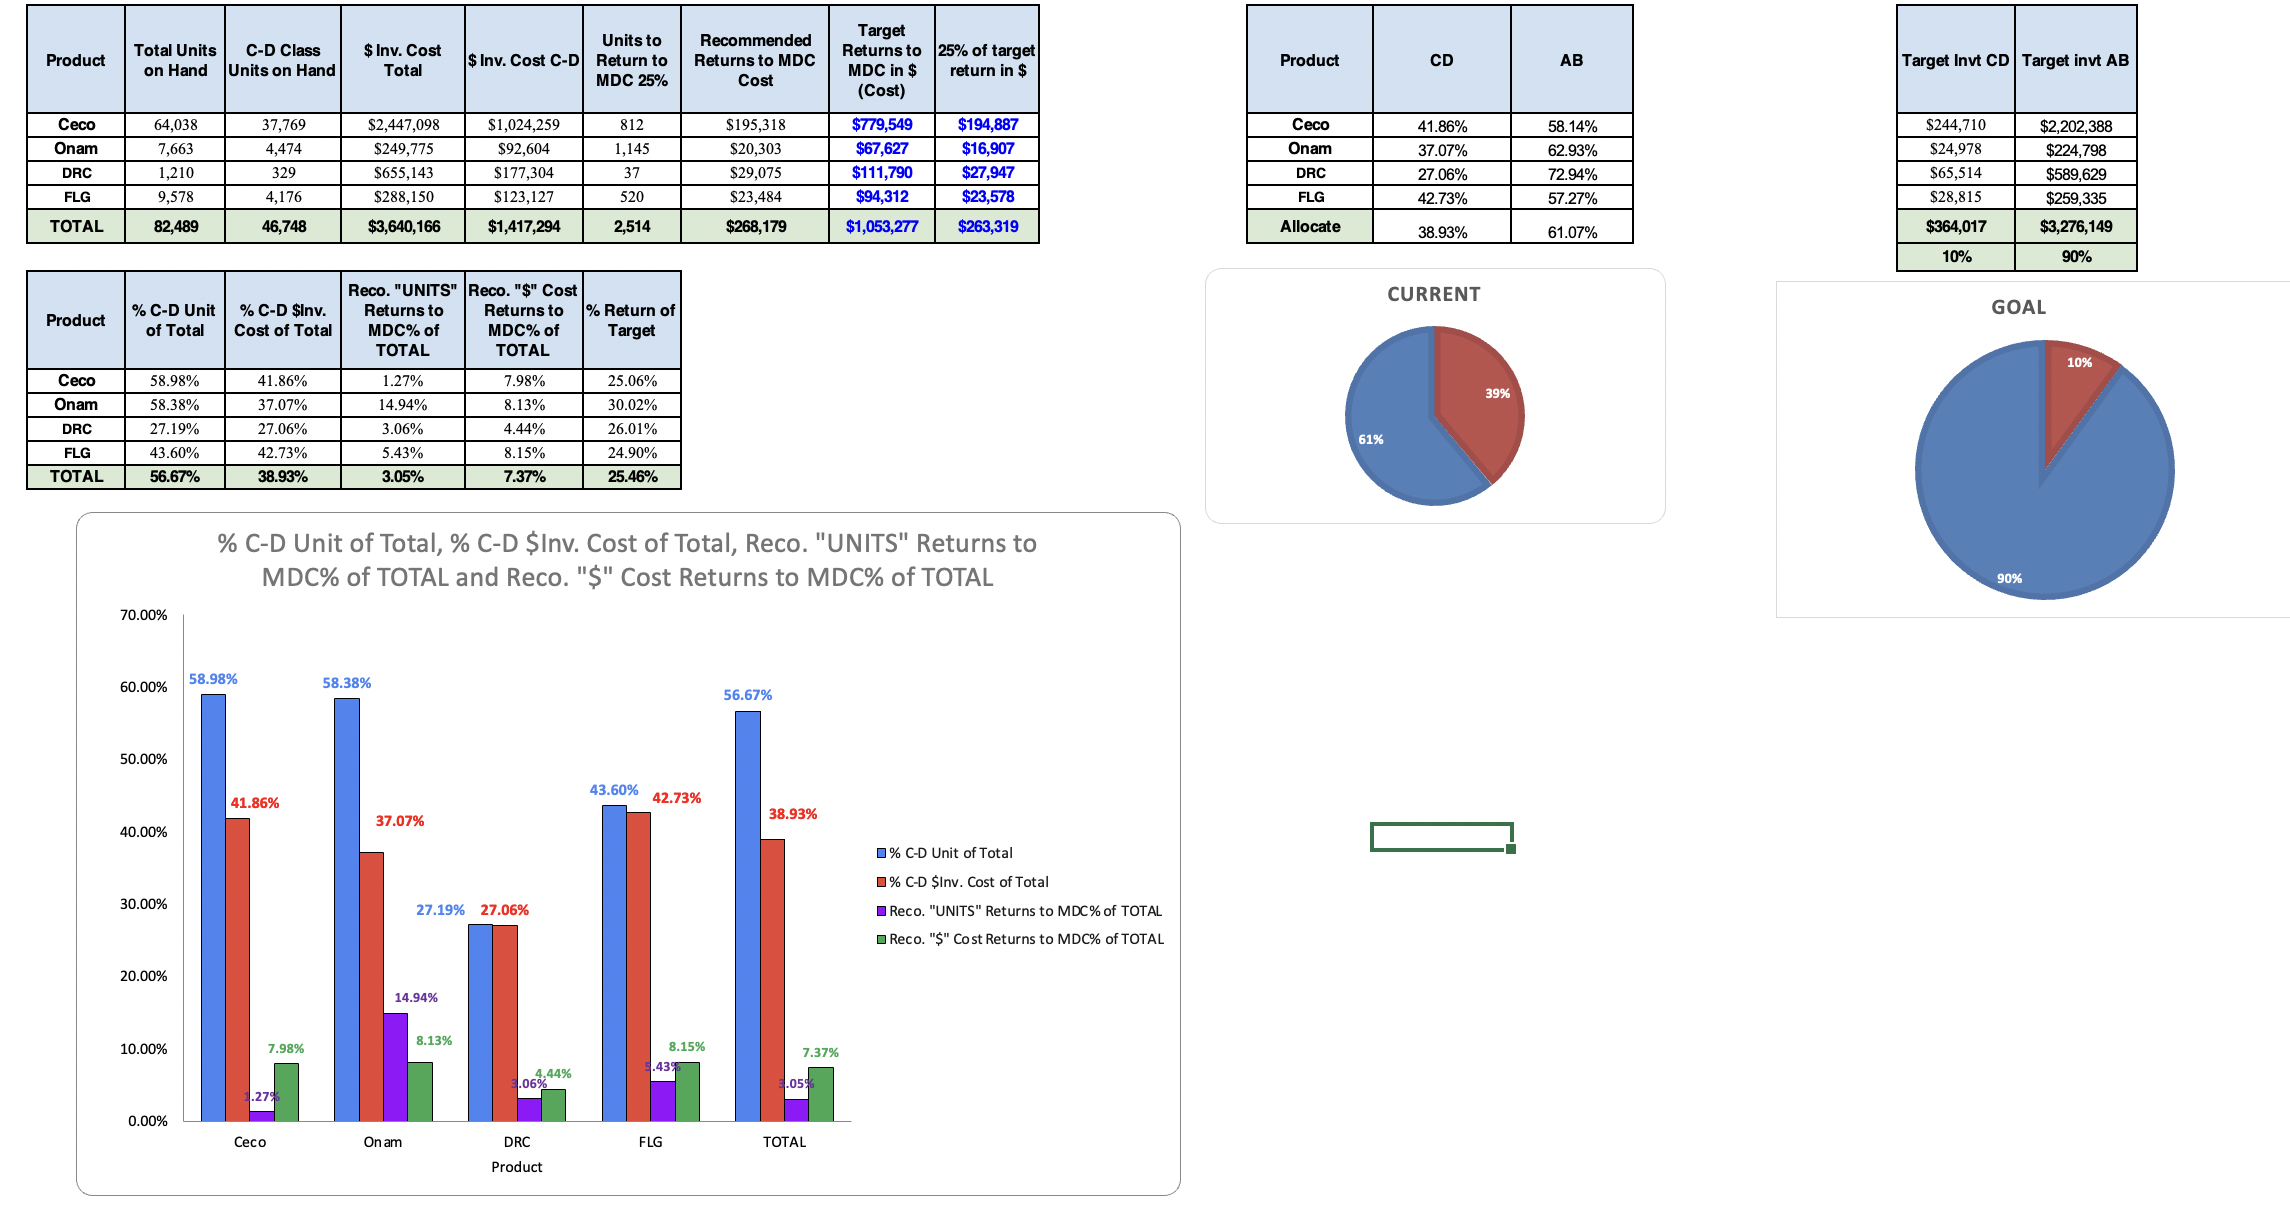
Through my professional experience, I have successfully reduced slow-moving inventory and implemented safety stock systems. I have also created valuable process manuals and guides to streamline onboarding and ensure consistent operations. In the process, I’ve learned how to keep operations in line with organizational goals, streamline logistics, and build strong working relationships with both internal and external stakeholders.

Projects

Project 1
Project 1

I managed an inventory optimization project by applying ABC analysis to optimize profitability and reduce holding costs. Analyzed Irvine Cummins Parts Warehouse inventory, creating a dashboard to visualize slow-moving stock and developing a prioritized return list. Reduced slow-moving inventory from 40% to 10%.

Blog Post
Project 2
Project 2

Using randomly generated data I created this dashboard that provides a comprehensive overview of key demographic, financial, professional, and geographic insights for a group of 35 individuals. Professionally, the group spans multiple sectors, including teaching, health, agriculture, IT, construction, and general work.

Blog Post
Project 3
Project 3

I designed this dashboard as part of an Excel-based app I built, using randomly generated data to simulate real business performance metrics. It tracks and compares 10 employees across key indicators: total sales, payments received, return on investment (ROI), and hours worked.

Blog Post
Project 4
Project 4

An interactive dashboard to visualize worldwide sales and profit performance

Blog Post
Project 5
Project 5

An interactive dashboard for tracking sales, profits, and top performers

Blog Post
Project 6
Project 6

Interactive financial dashboard to provide a clear, real-time view of both current month (CM) and year-to-date (YTD) performance

Blog Post

Skills

Python
Python

100 Days of Code: The Complete Python Pro Bootcamp

Link to bootcamp
Data Visualization
Data Visualization

Business Intelligence, Data Connectiion, Power Query Basic, Creating Visuals, DAX, Dashboards.

Link to course
SQL
Analyze Data with SQL

SQL, Data Science, Command Line, SQLite, Databases, Queries, Tables, and more.

Link to course
Data Storytelling
Data Gathering

In data science, you need to gather data, extracting, parsing, and scraping data from various sources, both internal and external as a critical first part in the data science pipeline.

Link to course

Contact Me

diegogv6@gmail.com
(310) 954-7446