Sales Performance Dashboard
An interactive dashboard for tracking sales, profits, and top performers
This dashboard has been created to showcase proficiency in Power BI. It is important to note that all data presented within this dashboard is entirely random and fictitious. None of the information reflects real-world data from any company or organization. The dataset was generated solely for the purpose of practice and to demonstrate data visualization and analytical skills using Power BI.
Project Overview
I created this interactive dashboard using Power BI to track and analyze sales performance over time, across regions, and by both sales reps and customers. It helps identify top performers, profitable markets, and trends that drive business growth.
Key Features
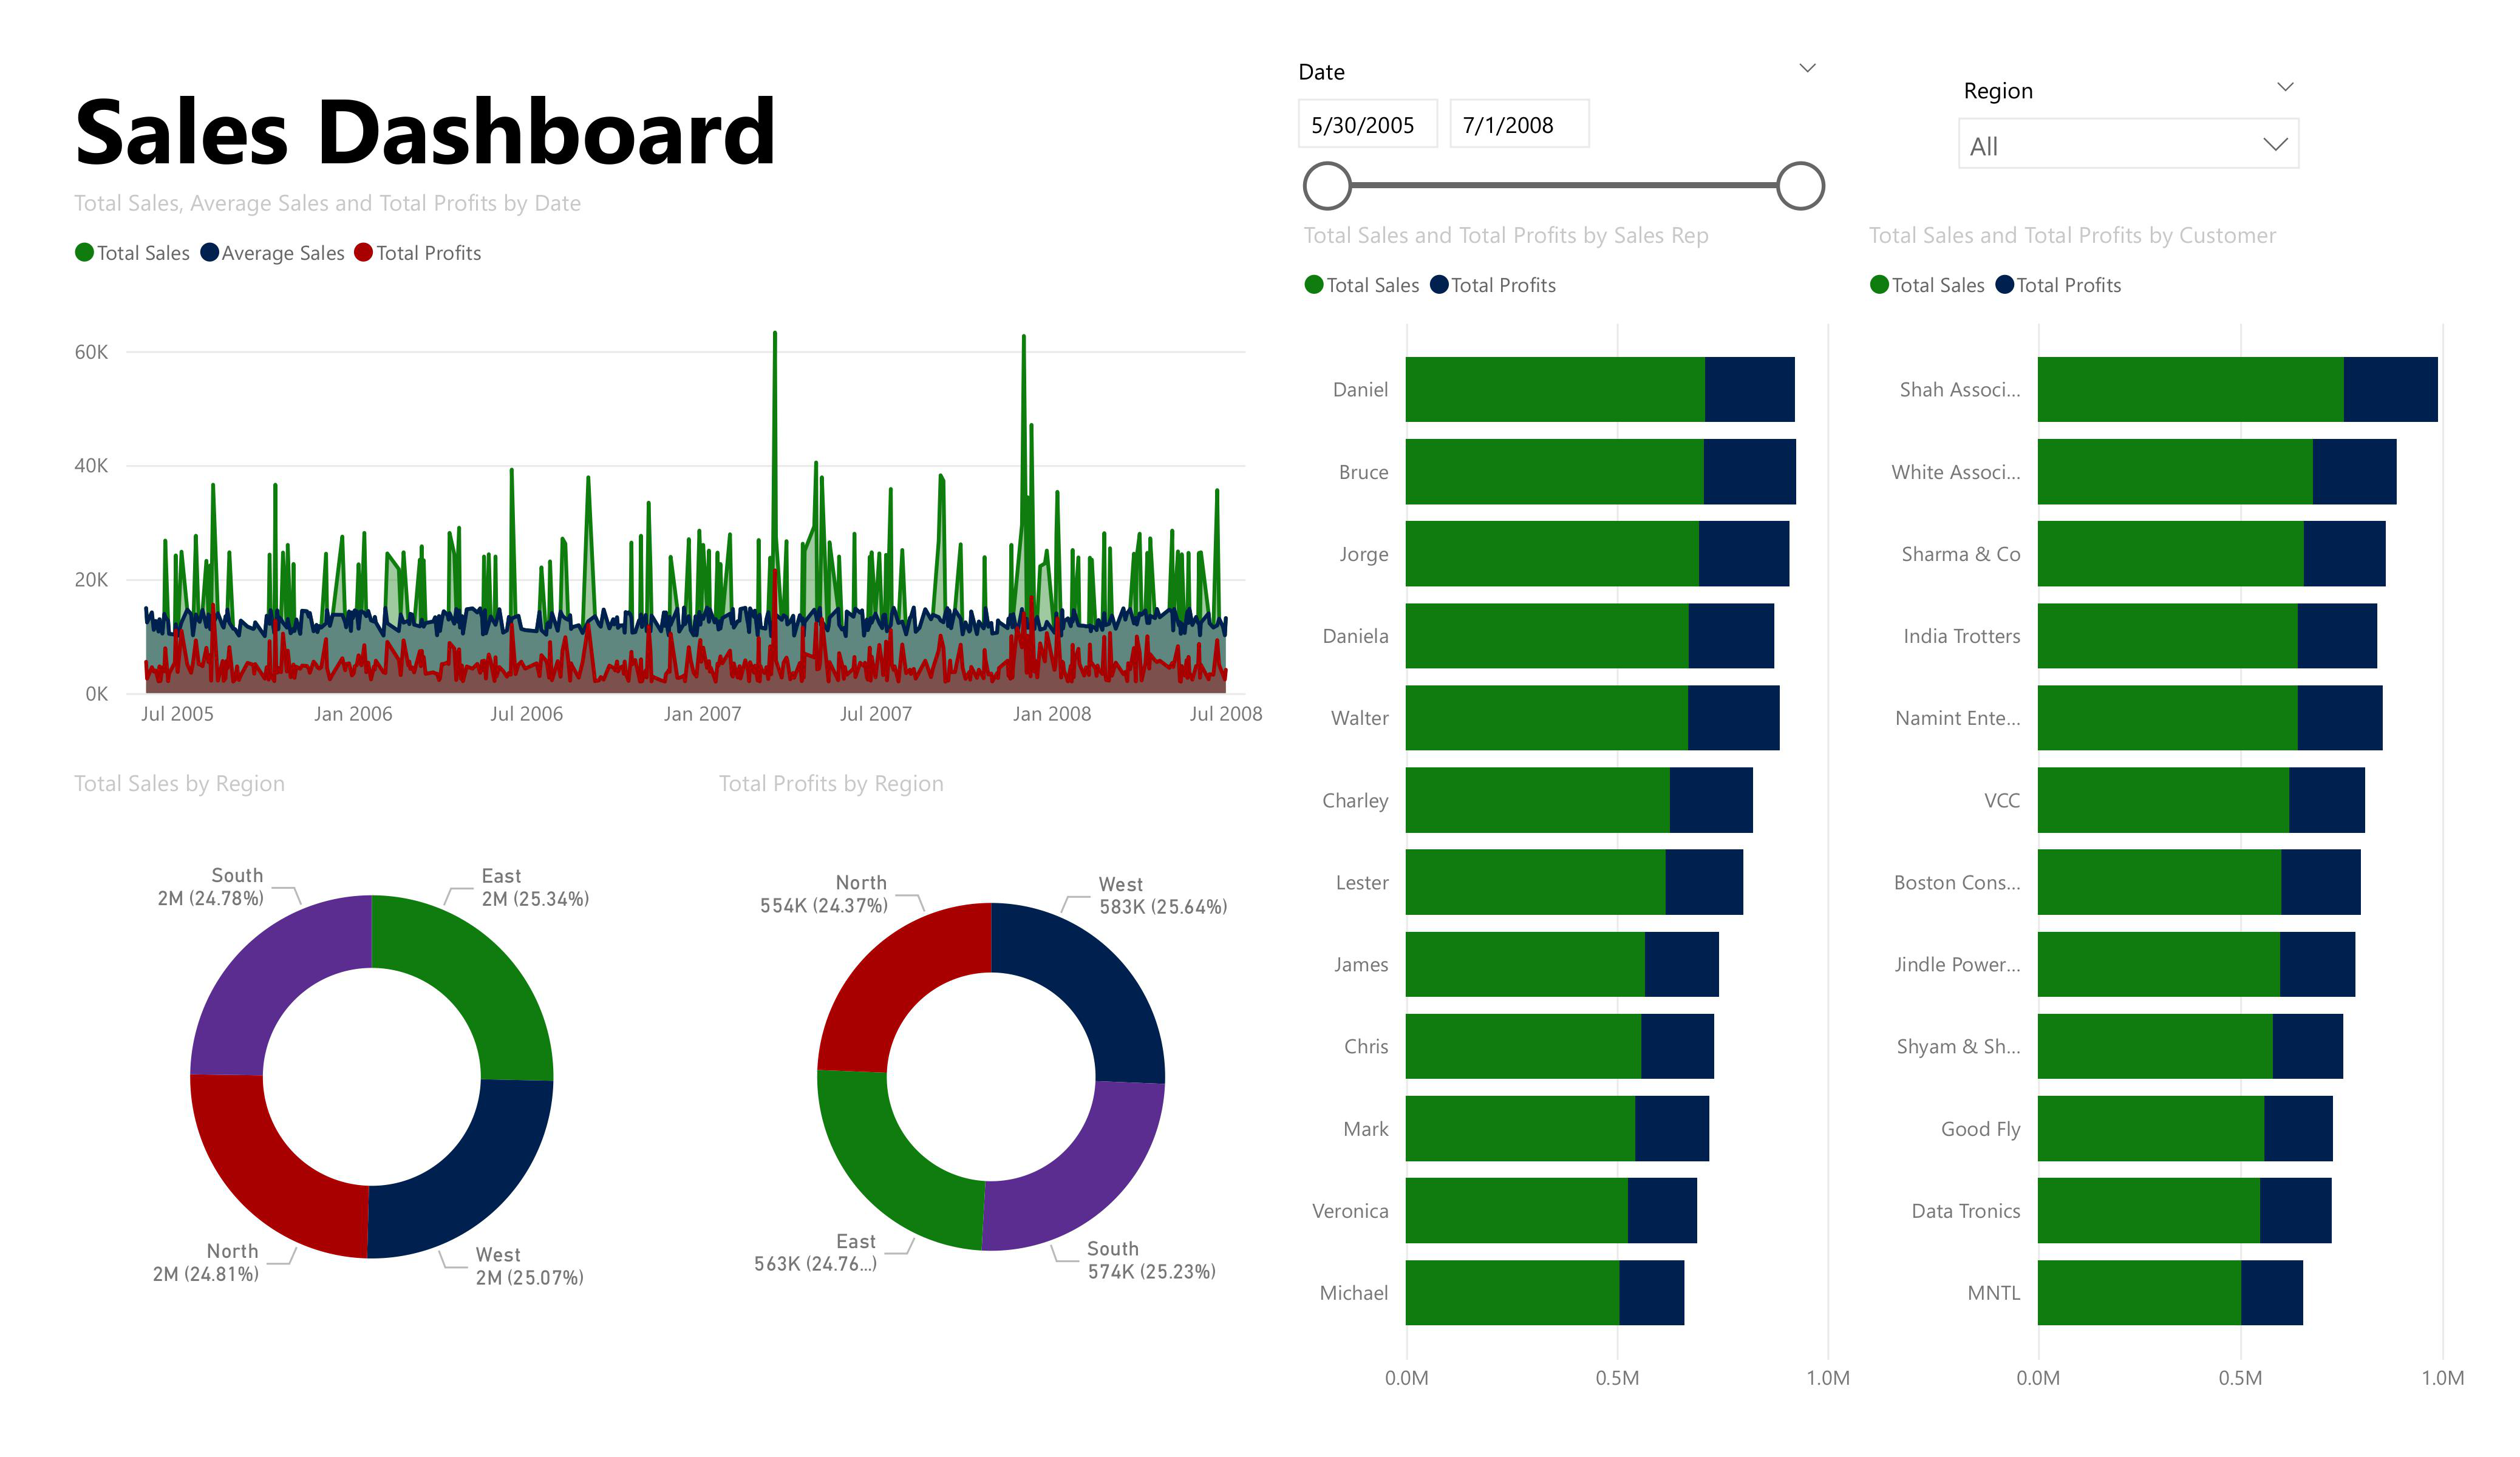
- Trend Analysis: Time-series chart tracking total sales, average sales, and total profits over a three-year period.
- Regional Insights: Separate charts for sales and profit distribution across North, South, East, and West regions.
- Performance Rankings: Horizontal bar charts ranking sales reps and customers by their contribution to revenue and profit.
- Interactive Filters: Date range and region selectors to focus on specific periods or markets.
Impact
This dashboard consolidates critical sales data into one place, enabling managers to monitor trends, identify key customer segments, and recognize top-performing sales reps. With interactive controls and clear visuals, decision-makers can quickly adjust strategies to maximize revenue and profitability.